Tech / Biz KPIs Key Performance Indicators
KPIs Key Performance Indicators has been around for ages, but they are highly mentioned in our meetings with client and prospects when it comes to digital marketing. Here's a quick recap for your information.
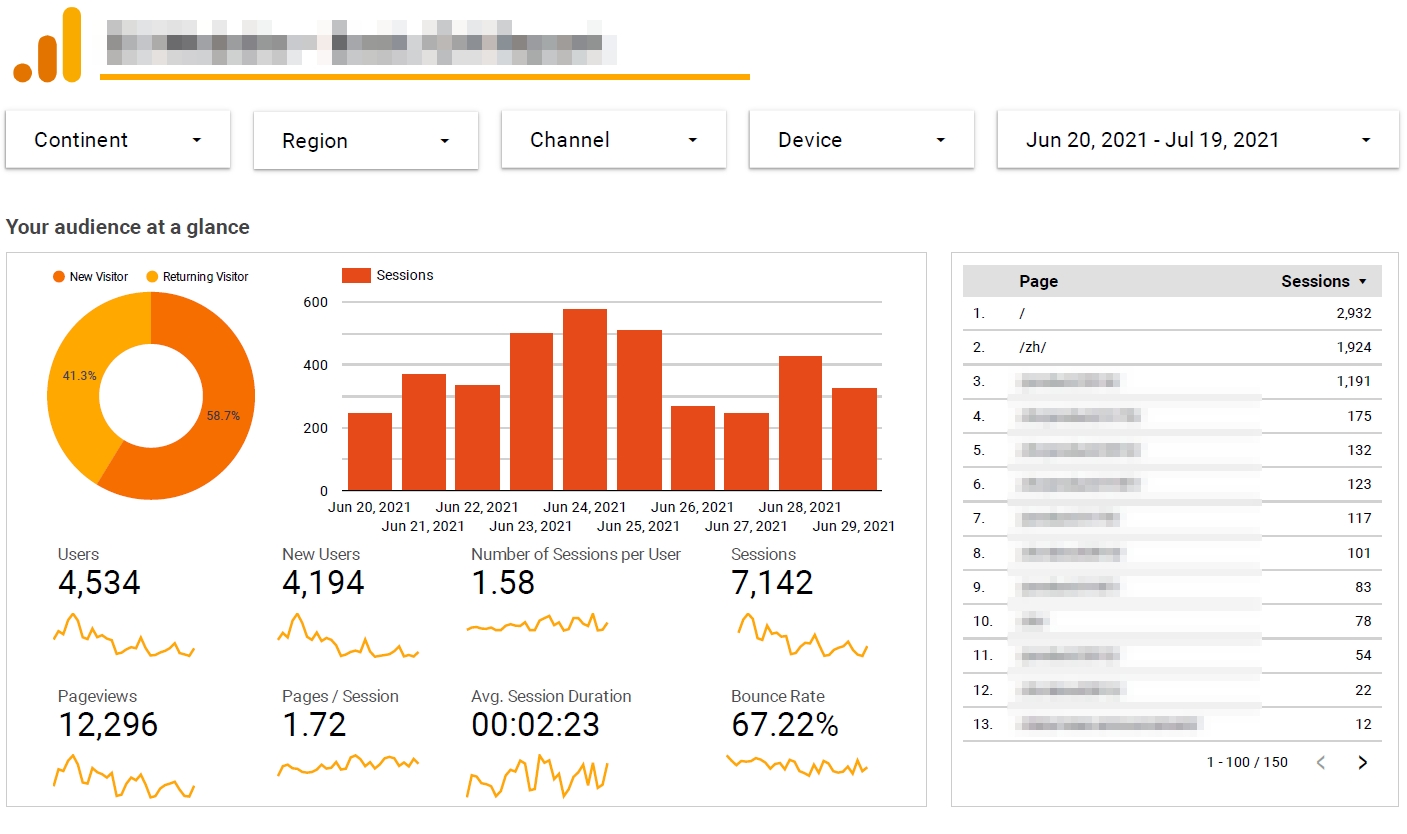
Website KPIs - Google Analytics
There are many platforms to track website analytics, we'll use Google Analytics as an example. Some common KPIs / Metrics as below.
| KPI / Metrics | Description |
| Session | A visit to your website. |
| Session Time | Duration of stay on the website. E.g. expect at least few minute per session if you are blogging. |
| Pages per Session | Page visits during the session. Useful to check which page is popular and users preferred language. |
| Bounce rate (BR) | % of users leaving site after one page visit.
Depending on your site nature, BR value varies. E.g. for a news agency site with different content/pages, BR should be relatively low as you expect viewers to browse around. Note: having a high BR of 95-100% may imply to a technical issue on your site home/landing page! |
| Clicks / Events | Record number of clicks (or events) for a particular action. This is useful for online shops, e.g. tracking what product is most clicked for a period of time. |
| Organic Searches | Means the site visit is from search engines. E.g. Running advertisement campaign on other platform having direct links to your website, may result in a lower organic visits ratio during that period. |
| CTR Clickthrough Rate | Number of clicks directly from your Ads. E.g. Clicks from your Google Ads. A low CTR may mean your Ads keywords, images may be irrelevant and needs to be looked at. |
| Devices / Browsers | Track devices used to view the website. Combine this with other metrics to see how your desktop / mobile layout performs. |
| Avg. Page Load Time | Average time to completely load a page(s) for visitors. This provide a good indication on your website performance technically. A common contributor to this are large raw images on the site. Web Apps has features to compress uploaded images and display responsive images accordingly (shows compressed, smaller images for mobile devices). |
Mobile App KPIs
Mobile App deployment platforms (Apple iOS, Google Android etc.) has common KPI dashboard for your deployed apps. With little configurations, more advanced KPIs providers are available such as technical performance KPIs for gaming. Investors and client are mainly interested in monetization metrics and ROI (Return on Investment) indicators.
Basic App KPIs / Metrics
| KPI / Metrics | Description |
| Basic App Metrics | |
| Installs, Uninstalls, Active Users, Users Growth, Platforms | Basic user-based stats for your mobile app, common but important. |
| UI/UX Indicators | |
| App Loading Speed, Startup time, Transition time | This involves application starting time, time spent leaving and re-entering the app, and general menu transition speed. These UX metrics should perform consistent on low-end devices to cover a larger user base. Developers can add device-specific codes, e.g. Game apps to run on lower-resolution / fewer textures on slower mobile devices. |
| Retention Rate | How often your app is used, represented in day(s) timescale. E.g. a Day 7 retention rate of 10% would mean 10% of users are still using your app 7 days after installation. Social media apps with constant update/feeds and notifications will keep user engaged and thus a higher RR. |
| Performance | |
| Concurrent Users | Active users for a period of time. |
| Avg. Latency | Most web apps communicate with a server backend for functions. Latency measures the total time to get a reply from server after sending a request out. Very important for multiplayer gaming apps. |
| Performance on Devices | Devices for users. Perf. indicators are compared on different devices to ensure the application is smooth on all specifications and OS platforms. E.g. Poor performance on Apple iOS only, means the app code base may need tweaking for iOS development. |
| Monetization | |
| COA Cost of Acquisition | Cost of acquiring a new user, mostly use to evaluate advertisement effectiveness. E.g. a $1000 ad campaign with 4000 new users, then COA = 1000 / 40000 = $0.25 |
| CPI Cost Per install | Similar to COA but counted against app installs only. Note a new install does not mean a completed user registration on your app. |
| CPA Cost Per Action / Order | Calculate the average cost of your advertisements for an user to take a specific action on your App, usually In-App purchases (include shopping orders). Another indicator to check if your ads campaign are effective. |
| LTV Lifetime Value | Sum of all revenue generated from your App including In-App purchases, advertisements if any, referral commissions etc. |
| Average Income per User | Total income generated from your app for a period of time per registered user. |
Above are some KPIs that were frequently bought up from our experiences. Also, every client has their own set of KPIs, even if they are in the same industry. There is no standard for KPI namings, each company has their own "names" for the KPIs even though they mean the same thing.
We get interesting requests to implement specific KPIs that span across different apps, even departments... where the senior management wanted to "stats" everything together and monitor performance, revenues and costs with a simple report. Hope this article helps, stay safe!